10.7. The system monitor
The Self system contains a system monitor to display information about the internal workings of
the system such as memory management and compilation. It is invoked with _Spy: true (there
is are shortcuts in the shell, spyOn and spyOff). When it is active, the system monitor takes over
a portion of your screen with a window that looks like this:
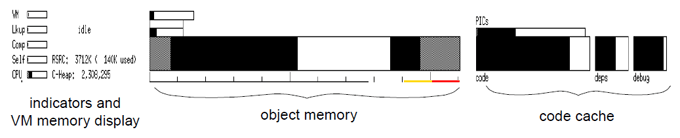
The indicators in the left part of the display correspond to various internal activities and events. On the very left are the CPU bars which show how much CPU is used in various parts of the system. The following table lists the individual indicators:
CPU |
Bar What It Means |
|---|---|
VM |
CPU time spent executing in the VM, i.e. for primitives, garbage collection etc. |
Lkup |
CPU time used by compile-time and run-time lookups. |
Comp |
CPU time spent by the Self compilers. The black part stands for time consumed by the non-inling compiler (NIC), the gray part for the simple inlining compiler (SIC). |
Self |
CPU time spent executing compiled Self code. The black part stands for time consumed by unoptimized (NIC) code, the gray part for optimized (SIC) code. |
CPU |
This bar displays the percentage of the CPU that the Self process is getting (a completely filled bar equals 100% CPU utilization by Self). Black stands for user time, gray for system time. |
Dot |
Below the CPU bar is a small dot which moves whenever a process switch takes place. |
Indicator |
What It Means |
|---|---|
X-compiling Y |
The X compiler (where X is either “nic” or “sic”) is compiling the method named Y into machine code. |
scavenge |
The Self object memory is being scavenged. A scavenge is a fast, partial garbage collection (see [Ung84] , [Ung86] , [Lee88] ). |
GC |
The Self object memory is being fully garbage-collected. |
flushing |
Self is flushing the code cache. |
compacting |
Self is compacting the code cache. |
reclaiming |
Self is reclaiming space in the code cache to make room for a new method. |
sec reclaim |
Self is flushing some methods in the code cache because there is not enough room in one of the secondary caches (the caches holding the debugging and dependency information). |
ic flush |
Self is flushing all inline caches. |
LRU sweep |
Self is examining methods in the code cache to determine whether they have been used recently. |
page N N |
page faults occurred during the last time interval (N is not displayed if N=1). The time interval currently is 1/25 of a second. |
read |
Self is blocked reading from a “slow” device, e.g., the keyboard or mouse. |
write |
Self is blocked writing to a “slow” device, e.g., the screen. |
disk in/out |
Self is doing disk I/O. |
UNIX |
Self is blocked in some UNIX system call other than read or write. |
idle |
Self has nothing to do. (shows up only when using processes.) |
The middle part of the display contains some information on VM memory usage displayed in textual form, as described below:
Name |
Description |
|---|---|
RSRC |
Size and utilization of the resource area (an area of memory used for temporary storage by the compiler and by primitives). |
C-Heap |
Number of bytes allocated on the C heap by Self (excluding the memory and code spaces and the resource area). |
The memory status portion of the system monitor consists of bars representing memory spaces and their utilization; all bars are drawn to scale relative to one another, their areas being proportional to the actual sizes of the memory spaces. The next table explains the details of this part of the system monitor’s display.
Space |
Description |
|---|---|
object memory |
The four (or more) bars represent (from top to bottom) eden, the two survivor spaces, and subsequent bars are segments of old space. The left and right parts of each bar represent the space used by “plain” objects and byte vectors, respectively. The above picture shows a situation in which about half of old space is filled with plain objects and about 25% is filled with byte vectors. A fraction of old space’s used portions is currently paged out (gray areas). Below the old space is a ruler, marked in 1Mb intervals, showing the total allocated in old space (extending line at the left). To the right is a red bar representing how much of old space is reserved for use by the Virtual Machine, and a yellow bar representing the low space threshold (when crossed, the scheduler is notified and a garbage colelction may take place). |
code cache |
These four bars represent the cache holding compiled methods with their associated debugging and dependency information. The bar labelled ‘code’ represents the cache containing the actual machine code for methods (including some headers and relocation information); it is divided into code generated by the primary (non-inlining) compiler, or NIC, and code generated by the secondary, smarter compiler (SIC). The cache represented by the bar labelled ‘deps’ contains dependency information for the compiled methods, and the cache represented by the bar labelled ‘debug’ contains the debugging information. The three-way split reduces the working set size of the code cache. The cache represented by the bar labelled ‘PICs’ contains polymorphic inline caches. |
Color |
Meaning |
|---|---|
black |
Allocated, residing in real memory. |
gray |
Allocated, paged out. |
white |
Unallocated memory. |